

The world doesn’t stand still. Neither should our thinking.
As we approach the final months of 2026, progress continues to unfold against a challenging backdrop. Geopolitical tension, persistent inflation and rising interest rates have shaped the investment landscape over the September quarter. Yet innovation, enterprise and adaptability remain important sources of longer-term opportunity.
At EWK, our focus is not on predicting every turn. It is on making considered decisions that support the lives our clients want to lead — adjusting the sails when conditions change, without ever losing sight of the destination.
This edition also widens the lens. Alongside our Australian indicators, we now track global share markets, look at how EWK portfolios are diversified around the world, and — after several rewarding years — take an honest look at preparing for the next downturn.
Market Pulse
Key indicators at home and abroad, as at 30 September 2026
| Quarter end | ASX 200 | MSCI World (US$) | AUD / USD | RBA cash rate | Aus 5-yr bond yield |
| 30 Sep 2026 | 8,789 | 4,903 | 0.695 | 4.60% | ~4.95% |
| 30 Jun 2026 | 8,779 | 4,826 | 0.688 | 4.35% | 4.10% |
| 31 Mar 2026 | ~9,050 | 4,258 | ~0.650 | 4.10% | ~3.95% |
| 31 Dec 2025 | ~8,920 | 4,430 | ~0.660 | 3.60% | ~3.85% |
| 30 Sep 2025 | 8,775 | 4,307 | 0.655 | 3.60% | 3.78% |
Figures are rounded quarter-end observations; ~ denotes an approximate value. MSCI World is a US-dollar price index of around 1,300 large and mid-sized companies across 23 developed markets.
|
4.0% Annual headline CPI, August 2026 |
3.6% Trimmed-mean inflation, steady for three months |
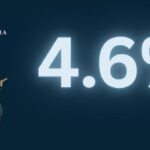
4.60% RBA cash rate — the highest since 2011 |
+13.8% Global shares over 12 months (MSCI World, US$) |
The September Quarter
Resilience under pressure
● Australian shares finished almost exactly where they began. The ASX 200 closed at 8,789, up 0.1% for the quarter — a second consecutive quarterly gain — despite a 3.2% fall in September that ended a five-month winning streak.
● The RBA lifted the cash rate to 4.60% on 29 September, its fourth increase of 2026, citing energy-price pressures linked to the Middle East conflict and capacity pressures at home.
● Headline inflation rose to 4.0% in the year to August, led by housing and fuel, with automotive fuel up 14.8% in August alone. Underlying inflation was steadier, holding at 3.6%.
● Bond yields rose around the world. Australia’s 10-year yield reached its highest level since 2011, while the US 10-year briefly passed 5.3% for the first time since 2002.
● The Australian dollar held close to US70 cents, ending the quarter at about 0.695.
● Global shares kept climbing, with the MSCI World Index up 1.6% for the quarter and 13.8% over 12 months in US-dollar terms — though leadership remained narrow and concentrated in AI-related technology.
Pressure and resilience, side by side. Up close, that is what most quarters look like. No single headline tells the whole investment story.
Chart 1 | Australian and Global Shares over the Past Year

Quarter-end index levels rebased to 100 at 30 September 2025. S&P/ASX 200 and MSCI World (US$) price indices — excludes dividends and currency effects. December 2025 and March 2026 ASX values are rounded.
Australia’s Interest-Rate Cycle
The rhythm of change
The cash rate has risen by a full percentage point since the start of 2026 (shaded below), taking it to its highest level since late 2011. The Board has said it is prepared to move again if needed, while most economists surveyed before the decision expected rates to hold at 4.60% through December.
Chart 2 | RBA Cash Rate Target, 2007 – October 2026

Source: Reserve Bank of Australia. Shaded area marks the 2026 tightening phase; quarter-end settings for 2026 are consistent with the Market Pulse table.
Higher rates cut both ways. They raise the cost of borrowing, and they also lift the return available on cash and fixed income. Seen across two decades, today’s setting sits well within the familiar range. Every cycle on this chart once felt permanent. None of them were.
Around the World
A broader lens on global markets
Australia accounts for less than 2% of the world’s share-market value. Most of the world’s opportunities, and much of its growth, sit offshore, so what happens overseas shapes portfolios as much as anything on the ASX.
● United States. The S&P 500 rose 2.3% for the quarter, led by AI chips, cloud and data infrastructure. Beneath the surface, gains were narrow: in September the average US share fell 4.8%, even as the technology-heavy Nasdaq rose 1.9%. The Federal Reserve lifted rates to 3.75–4.00%.
● Europe and the UK. Euro-area business activity reached a 41-month high, yet European shares fell 2.4% in September, ending a five-month run. The European Central Bank raised rates to 2.50%; the Bank of England held at 3.75%.
● Japan. The Bank of Japan raised rates to 1.25%, continuing its gradual exit from ultra-low interest rates.
● Emerging markets. Taiwan and South Korea benefited from strong demand for semiconductors, while India fell 7.1% in September. Emerging-market shares remain among the strongest performers of the past year.
● Currency. A softer Australian dollar in September cushioned the returns of unhedged overseas shares for Australian investors — a quiet benefit of holding assets in more than one currency.
Chart 3 | Around the World, in Australian Dollars

Total returns in Australian dollars to 30 September 2026, measured by representative index-tracking funds for each market (after fund fees). Global property, infrastructure and bonds are hedged to the Australian dollar. Source: fund manager data.
The spread is the lesson: from +21% for emerging markets to around −2% for global bonds over 12 months, and many markets moved differently over the quarter than over the year. Leadership rotates. Diversification is how a portfolio takes part without needing to predict which market comes next.
Inside an EWK Portfolio
Diversified by design
Every EWK client portfolio is broadly diversified, and none is built alone. In the background, we work with specialist asset consultants — experienced and practical people who research investment managers, monitor markets and adjust the mix thoughtfully as conditions change. Their work gives our clients a breadth and stability that would be hard to achieve any other way.
Diversification is not one decision but several layers working together:
|
Asset classes Shares, property, infrastructure, fixed interest, alternatives and cash |
Regions Australia, the US, Europe, Japan and emerging markets |
Industries From technology and healthcare to banks, resources and utilities |
Company size Global giants through to smaller, emerging companies |
Specialists Index funds and active managers, selected and monitored by experts |
The result is a portfolio that reaches well beyond the Australian share market, from the world’s largest technology companies to global property owners, infrastructure, bonds and Australian industry leaders, so that no single market, sector or headline determines the outcome.
A Moment in Time
The Strait, again
In July we noted that the conflict involving Iran had swung from crisis to ceasefire and back again. The September quarter kept the same rhythm. Through September, Gulf oil flows through the Strait of Hormuz recovered to more than 80% of pre-war levels, helped by naval escorts. Even so, Brent crude rose more than 10% over the month and briefly traded above US$100 a barrel. From late September, a wave of attacks on tankers pushed flows sharply lower once more, and by mid-October Brent was trading at around US$110.
This is not abstract. It shows up at the petrol pump, in household budgets and in the Reserve Bank’s reasoning. These events are confronting, and they matter. Our task is still to hold two truths at once: the present moment is significant, and the long-term journey continues beyond it.
Short-term movements are acknowledged. They are not allowed to define the journey.
Beyond the Headlines
Not all progress makes the news
Financial headlines naturally focus on immediate risks. Far less attention goes to the quieter forces shaping the future: productivity improvements, medical advances, new technologies, and the capacity of businesses to adapt. Even this quarter, economic surveys in the US and Europe mostly surprised to the upside.
|
What Made the News — Rate rises at home and abroad — Tanker attacks and oil above US$100 — Bond yields at multi-year highs — A September share-market pullback |
What Quietly Continued — Business surveys surprised to the upside — euro-area activity reached a 41-month high — Sustained investment in chips, cloud computing and networks — Companies adapting supply chains and energy use — Steady advances in medicine, science and productivity |
None of these are guarantees of investment returns. They are reasons to keep a broader perspective.
The Long View
Global equity markets, 2007 – September 2026
Every marked point on this chart was a moment when the news felt overwhelming and the way forward was unclear. Each was followed, in time, by recovery and new highs. Volatility is a recurring feature of the journey, not a change in destination.
Chart 4 | What the Line Climbed Through

Illustrative: MSCI World price index (US$), rebased to 100 in January 2007, using approximate period-end levels before 2025 and actual month-end closes since. Excludes dividends and currency effects.
Since 2010
What staying the course looks like
As I work through this year’s annual reviews, one thing stands out. For a number of clients, I can trace the journey back to July 2010. For more than fifteen years they have drawn on their investments — regular income, and ad hoc amounts for the moments that mattered — and today they still hold a significant capital base.
It has not been smooth sailing. Along the way they lived through the European debt crisis, the sharp falls of COVID in 2020, a negative year in 2022, pullbacks in 2024 and, now, conflict in the Middle East — with plenty of negative months in between. They came through by staying invested, staying broadly diversified, and being discerning about what they drew and when. In the background, EWK works with strong, stable asset consultants: practical, deeply knowledgeable people who bring a steadiness that markets themselves never will.
|
What Long-Term Success Had in Common 01 Staying in the market — through every headline, not just the comfortable ones. 02 Expert backing — the steady, practical knowledge of experienced asset consultants behind every portfolio. 03 Broad diversification — across asset classes, industries and countries. 04 Discerning drawings — regular income set at sustainable levels, and ad hoc withdrawals made with care. 05 Thinking ahead — the freedom to make plans, with the clear understanding that capital is never a bottomless pit. |
Freedom is not the absence of limits. It is knowing exactly where they are.
To those clients: well done. Your patience and discipline have been rewarded, and it has been a privilege to walk alongside you. To everyone else: this is what being smartly organised makes possible — thinking clearly, enjoying life, and letting expertise do the heavy lifting in the background.
Individual outcomes vary with each client’s circumstances, drawings and investment choices; past performance is not a reliable indicator of future performance.
Preparing for the Next Dip
Downturns are part of the journey, not a detour from it
Recent years have been kind to diversified investors, with several positive years in a row. That is precisely the moment to remember that another downturn will come — on its own timetable, and for reasons no one can forecast. Negative months, and from time to time negative years, are the price of the long-term growth that sustains drawings and builds capital.
The industry’s Standard Risk Measure puts this in perspective. It describes investment risk by the number of negative years an investor might expect in any 20-year period — and the more growth-oriented the portfolio, the more often those years arrive:
| Risk label | Negative years expected in any 20 | Roughly |
| Low to medium | 1 to fewer than 2 | 1 year in 10 to 20 |
| Medium | 2 to fewer than 3 | 1 year in 7 to 10 |
| Medium to high | 3 to fewer than 4 | 1 year in 5 to 7 |
| High | 4 to fewer than 6 | 1 year in 3 to 5 |
| Very high | 6 or more | 1 year in 3, or more often |
Source: Standard Risk Measure, developed by the Financial Services Council and ASFA. These are estimates, not guarantees; actual results may differ, and the measure does not show how large a negative year might be.
|
What Helps When Markets Fall ● Accessible reserves — so regular drawings never depend on selling at the wrong time. ● Sustainable drawings — set with care, and ad hoc withdrawals weighed against the long term. ● A disciplined process — working steadily in the background — not ad hoc decisions, and no crystal ball. ● Reviews, not reactions — a conversation before any change, rather than a decision made by headline. ● Time — every downturn marked on Chart 4 was, in time, followed by recovery — though no one can say how long the next will take. |
So our message is a simple one: be prepared, stay vigilant, and stay the course — as so many of our clients already have.
The Value of Having Choices
What wealth is really for
For many clients, financial success is not simply a portfolio balance. It is the ability to travel, to help family, to enjoy retirement, to meet unexpected costs, and to feel confident about the years ahead.
Being financially well organised, with sound advice behind you, connects investment decisions with income needs, accessible reserves and personal priorities. When near-term needs are already provided for, market volatility becomes something to observe rather than something to act on.
Chart 5 | The Foundations of Financial Choice

Conceptual illustration — not investment data or a portfolio recommendation.
Looking Ahead
What deserves attention?
As the year draws to a close, four themes warrant careful attention — including how each portfolio supports the life you want to lead.
|
Inflation and Interest Rates The late-October quarterly inflation release and the RBA’s November meeting will help show whether 4.60% marks the peak of this cycle. |
Energy and Geopolitics Shipping through the Strait of Hormuz, and the oil price that follows it, remains the swing factor for inflation here and abroad. |
|
|
Narrow Market Leadership Global gains have leaned heavily on AI-related technology. The sustainability of those earnings deserves careful, unexcited attention. |
Your Own Position Year-end is a natural moment to revisit cash reserves, income needs for 2027, and anything that has changed in your life or family. |
Reflections
What endures
● Headlines describe the moment; long-term decisions are built for the decade.
● The world is bigger than our share market, and well-built portfolios reflect it.
● Diversification matters most when market leadership is narrow.
● Reserves create calm; calm creates better decisions.
● Dips are part of the journey; preparation is what makes them bearable.
Steady as She Goes
A steady hand, an open mind
Staying the course does not mean standing still, and it has never meant smooth sailing. Over the years our clients have weathered COVID, the 2022 downturn and many difficult months in between. Recent years have been rewarding, but markets do not move in straight lines, and another dip will come — on its own timetable, not ours.
When it does, the approach will be the one that has served long-term clients well: broad diversification, specialist expertise working steadily in the background, drawings set with care, and decisions made by design rather than by headline. None of it relies on a crystal ball.
At EWK Private Wealth, we value the opportunity to guide you with care, perspective and discipline. Being well organised and smart with money — with experts beside you — is what gives you the freedom to enjoy it. Because the purpose of wealth is not simply to grow, but to support a life well lived.
If anything in your life has changed, or you’d like to talk through what this quarter means for you, we’d welcome the conversation.
Eleonor Klopsch CFP®
Director, EWK Private Wealth
|
General Information Only This newsletter has been prepared for general information and educational purposes only. It does not take into account your personal objectives, financial situation or needs, and is not a recommendation to buy, sell or hold any investment. Please speak with us before making any decision based on it. |
Sources and market data
Reserve Bank of Australia (29 September 2026 monetary policy decision; cash rate history); Australian Bureau of Statistics (Monthly CPI, August 2026); S&P/ASX 200 closing data (30 September 2026); MSCI World Index month-end closes (MSCI, via Yahoo Finance and ABC Bourse); published returns of representative index-tracking funds (30 September 2026); ASX Bonds Monthly Report, September 2026 (5-year yield proxy); MSCI, Janus Henderson Investors and LPL Research market reviews (September quarter 2026); Standard Risk Measure guidance (FSC/ASFA); Kpler and UKMTO shipping data as reported by Al Jazeera (October 2026); Brent crude pricing as reported by CNN and Bloomberg (October 2026); Market information reflects publicly available data as at 30 September 2026, with subsequent developments observed to 20 October 2026. Charts are illustrative and educational.
Important information: Prepared by EWK Private Wealth Management Pty Ltd for general information and educational purposes only, without regard to your individual objectives, financial situation or needs. Consider whether this is appropriate to your circumstances and seek personal financial advice before acting. Past performance is not a reliable indicator of future performance; investment markets can rise and fall, and no assurance is given that any investment strategy or objective will be achieved. References to market movements or asset classes are illustrative only and are not recommendations to buy, sell or hold any investment.
EWK Private Wealth Management Pty Ltd (ACN 135 479 757, Corporate Authorised Representative No. 336643) is an authorised representative of EWK AFSL Pty Ltd (ABN 38 693 721 229, Australian Financial Services Licence No. 700235). Liability limited by a scheme approved under Professional Standards Legislation.